

Antenne e interferenza en
From "Physics, Waves, Music": a website about the physics of waves and sound, acoustics of musical instruments, musical scales, harmony and music.
| AI-translated from Italian. Original page: Antenne_e_interferenza |
How to exploit interference to design directional antennas
- The simplest type of antenna emits waves in all directions: spherical waves. It is equivalent to a point source.
- It is particularly interesting to study what happens when many point sources are arranged in certain simple spatial configurations.
- The emission of the set of sources is the superposition of the emissions of each individual source. Destructive or constructive interference therefore occurs, determining the shape of the outgoing wave.
- Below we consider two particularly simple cases:
- all the sources emit waves with the same phase (that is, they all reach their maximum at the same instant)
- the sources emit with different phases
Interference between in-phase point sources
- In the following examples all the point sources (in red) emit spherical waves at the same frequency and in phase with each other.
- As the animations show, when several point sources are placed in a line, the interference is always destructive along some directions and always constructive along others.
| Wave amplitude | Radiated intensity | Comment | |
|---|---|---|---|
| Single spherical source | 
|

|
The emitted wave is the same in all directions. The power radiated by the source is spread over the whole surface reached by the wave. In three dimensions this surface is a sphere, and is therefore proportional to the square of the distance from the source. The power per unit area therefore decreases with the inverse square of the distance. |
| coherent 2x array | 
|

|
The interference is always constructive along the axis of the pair of sources (the line perpendicular to the segment joining them), while it is destructive along the line joining them. The intensity of the wave is therefore no longer spread throughout space, but is radiated along a well-defined direction. The antenna has become directional! |
| coherent 4x array | 
|

|
This case is entirely analogous to that of two sources. The directionality increases as more sources are added. |
| coherent 8x array | 
|

|
When the sources become many, by Huygens' principle the antenna becomes equivalent to a single continuous emitter. This shows how, instead of many individual point sources, an antenna can consist of a single continuous body (think, for example, of ordinary UHF television antennas). |
Interference between out-of-phase point sources
In the following images, when several sources are present, each one emits with a phase difference of π with respect to its neighbours.
- In the following examples all the point sources (in red) emit spherical waves at the same frequency, but each source emits in antiphase with respect to its nearest neighbours.
- In this case too, when several point sources are placed in a line, the interference is always destructive along some directions and always constructive along others, but the resulting patterns differ from those obtained with in-phase sources.
| Wave amplitude | Radiated intensity | Comment | |
|---|---|---|---|
| Single spherical source |
|
|
The emitted wave is the same in all directions. The power radiated by the source is spread over the whole surface reached by the wave. In three dimensions this surface is a sphere, and is therefore proportional to the square of the distance from the source. The power per unit area therefore decreases with the inverse square of the distance. |
| dipole | 
|

|
As with the coherent array, the antenna radiates in one direction and not in the perpendicular one, but in this case the emission is along the line passing through the two sources, not along its axis. |
| planar quadrupole | 
|

|
An example of a planar, rather than linear, configuration. |
| 8x phased array | 
|

|
This four-lobe emission is obtained by alternating sources in phase and in antiphase. Of course, many other patterns are possible by adjusting the relative phases of each source. This is why the configuration is called a phased array. |
Remarks and further details
- The examples above refer only to discrete distributions of point sources. However, we have shown how easy it is to approach the limit of continuous distributions. This also holds for two-dimensional distributions, that is, for plates and membranes. For example, the membrane of a loudspeaker is typically directional for frequencies above a certain value and typically tends not to radiate frequencies below another value. Radiation patterns in complex cases can be determined in the same way as above. The calculations, however, can be much more laborious and are not dealt with here.
- In the cases examined above, the directionality of the antennas was studied only at a single fixed frequency. In reality, radiation patterns change as the emitted frequency changes. A given antenna, for example, could be strongly directional at high frequencies and behave like a single point source at low frequencies.
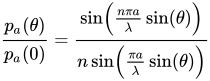
- This effect can easily be appreciated in another way, by studying the directionality of the simple coherent 2x array keeping the wavelength fixed but varying the distance between the sources. As the distance between the two sources changes, many very different patterns can be obtained.
|
The function shown, which represents the radiated amplitude as a function of angle, relative to the value radiated at zero angle, corresponds to the formula where
|
|

Virtual laboratory: interference experiments
If you are interested in visualising interference phenomena, connect to our 2D Waves virtual laboratory. Below we suggest a series of guided experiments, but you are free to try out new configurations and new experiments. The app is very intuitive; to understand correctly what you observe, just keep in mind that the coloured areas represent the amplitude of the oscillation. The brighter the colour, the larger the amplitude of the oscillations (green for crests, red for troughs). Of course, the dark areas represent the absence of oscillation caused by destructive interference.
Suggested experiments:
- Interference between two or more point sources of the same frequency
- Interference between two point sources of different frequencies
- Interference between waves of different frequencies generated by a single source (beats)
- Reflection from a parabolic mirror
Links
- See also the pages on interference in general and on the mathematical aspects of interference.
- For a discussion of the validity and foundations of the concept of superposition, see superposition principle
